
This is the final part of my “Building an MIS for your startup’ series. Here is the first part in case you haven’t read it. In today’s newsletter, I will cover cash flow statement and a few other business metrics that matter when preparing MIS.
Cash Flow Statement
The cash flow statement presents consolidated information on all cash inflows and outflows of a company that happen from its day-to-day operations and external investments.
Even though the cash flow statement can be prepared in both direct and indirect methods, I have seen a preference for the direct method among startup operators and investors when it comes to MIS. So in today’s newsletter, I will discuss the direct method.
Segments of Cash Flow Statement
Cash Flow from operating activities: Cash flow from operating activities is a key segment in a company's financial statements. It provides insights into its ability to generate cash from its core business operations. It represents the cash generated or used by a company's normal business operations. Some examples of inflow/outflow of cash flow from operating activities are -
Receipts from customers: Cash collected from the sales of goods or services.
Payments to suppliers: Cash payments for goods and services needed for the company's operations.
Payments to employees: Cash payments for wages and salaries.
Admin expenses: Cash payments for other operating expenses such as rent, and utilities.
Analyzing cash flow from operating activities is crucial for investors, creditors, and management, as it provides insights into a company's ability to meet its short-term obligations, invest in future growth, and return value to shareholders. Keep in mind that this metric is just one aspect of a comprehensive financial analysis, and it should be considered alongside other financial metrics for a more complete picture of a company's financial health.
Cash Flow from investing activities: Cash flow from investing activities is a section in the statement of cash flows that outlines the cash transactions associated with a company's investments in long-term assets and securities. This section provides information about how much cash a company is spending on, or receiving from, activities such as buying or selling property, plant, equipment, and investments in financial instruments. Some examples of inflow/outflow of cash flow from investing activities are -
Capital Expenditures (CapEx): Cash payments for the acquisition of physical assets such as property, plant, and equipment. This includes investments in buildings, machinery, vehicles, and other long-term assets.
Proceeds from the Sale of Investments: Cash received from the sale of marketable securities, bonds, or any other investments.
Purchase of Investments: Cash payments for acquiring marketable securities, bonds, or other investments.
Acquisition or Sale of Businesses: Cash transactions related to the purchase or sale of subsidiaries or other businesses.
Cash Flow from financing activities: Cash flow from financing activities is a section in the statement of cash flows that outlines the cash transactions associated with a company's financing activities. These activities involve the company's owners (equity financing) and creditors (debt financing). Some key components of cash flow from financing activities are:
Issuance of Debt: Cash received from issuing bonds or taking out loans.
Issuance of Equity: Cash received from issuing new shares of common stock.
Repurchase of Equity (Buybacks): Cash payments made to repurchase the company's own shares.
Payment of Dividends: Cash payments made to shareholders in the form of dividends.
Repayment of debt: Paying back the debt amount is reflected here in the cash flow statement.
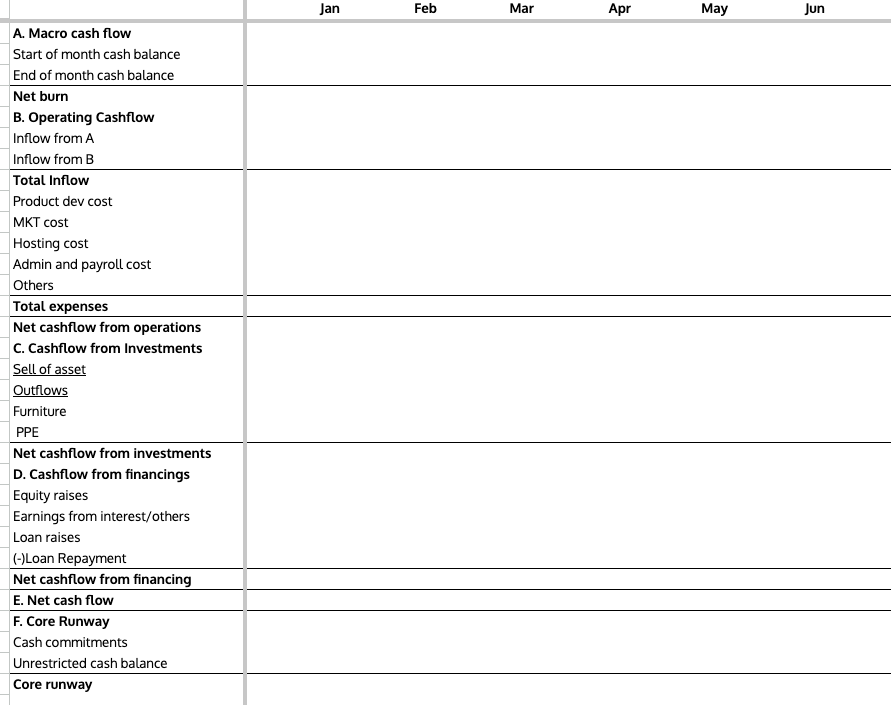
Here is a sample cashflow statement for MIS.
Two Key Cash Flow Metrics for Startups
For startups, managing cash flow is critical for survival and growth. Cash flow metrics can help entrepreneurs and investors assess the financial health and sustainability of a startup. Here are two key cash flow metrics for startups:
Burn Rate:
The "burn rate" refers to the rate at which a company is using or "burning" through its cash reserves. It's a measure of how quickly a startup is spending its available capital to cover operating expenses before it becomes profitable or secures additional funding.
The burn rate is typically expressed as a monthly figure and is calculated by subtracting the total cash inflows (such as revenue, investments, or loans) from the total cash outflows (operating expenses, salaries, marketing costs, etc.). The formula for the burn rate is:
Burn Rate=Cash Outflow−Cash Inflow
A positive burn rate means that the company is spending more money than it is bringing in, resulting in a decrease in cash reserves over time. A negative burn rate indicates that the company is generating more cash than it is spending.
Runway:
Runway refers to the amount of time a company has before it exhausts its available cash resources, assuming no additional cash inflows. It's a critical metric used to assess the financial sustainability of a startup.
Runway is calculated by dividing the current cash reserves by the burn rate:
Runway= Current Cash Reserves/ Burn Rate
The runway essentially tells a startup how much time it has until it runs out of money based on its current spending rate. It's a crucial metric for financial planning and management. A longer runway provides more time for the startup to become profitable, secure additional funding, or take other measures to sustain itself.
Some other Key Business Metrics You Should Track in MIS
Customer Acquisition Cost:
Customer Acquisition Cost (CAC) is a metric that represents the average cost a company incurs to acquire a new customer. It is an important metric for businesses, especially startups, as it helps assess the efficiency and effectiveness of their marketing and sales efforts. Calculating CAC involves dividing the total costs associated with acquiring customers by the number of new customers acquired during a specific period.
The formula for calculating Customer Acquisition Cost (CAC) is:
= Total Marketing and Sales Expenses/ Number of New Customers Acquired
Retention Rate:
Retention rate is a crucial metric that measures the percentage of customers or users a business retains over a specific period. It is commonly used in various industries to assess customer loyalty and satisfaction. A high retention rate is generally indicative of customer satisfaction and a strong relationship with the brand.
The formula for calculating the retention rate is:
User Retention Rate = [(CE - CN) / S] x 100
In this formula, CE is the number of users at the end of the time period, and CN is the number of users who signed up for subscriptions during the time period. S represents the number of users at the beginning of the time period.
Lifetime value:
Lifetime Value (LTV) is a critical metric that estimates the total revenue a business expects to earn from a customer throughout their entire relationship. It is a valuable metric for understanding the long-term value that each customer brings to the business. Calculating LTV helps businesses make informed decisions about customer acquisition costs, marketing strategies, and overall profitability.
The formula for calculating Lifetime Value varies slightly depending on the level of detail and assumptions used, but a common approach is:
LTV=Average Purchase Value x Average Purchase Frequency x Average Customer Lifespan
Annual Run Rate:
Annual Run Rate (ARR) is a metric used to estimate the annualized revenue based on the current monthly or quarterly revenue. It provides a projection of how much revenue a company would generate over a year if its current performance and growth rate were to continue.
The formula for calculating Annual Run Rate is:
ARR=Monthly Revenue×12
or
ARR=Quarterly Revenue×4
Monthly Active Users:
Monthly Active Users (MAU) is a metric commonly used by businesses, particularly those in the technology and digital sectors, to measure the number of unique users who engage with a product, service, or platform within a given month. MAU is a key performance indicator that provides insights into the size and engagement level of an audience over a specific time period.
The formula for calculating Monthly Active Users is straightforward:
MAU= Number of Unique Users Engaging with the Platform/Service/Product in a Month. This can be both new and returning users but they have to be unique users.
This concludes my series on “Building an MIS for your startup”. I have tried to share the learnings that I acquired in the last few years. Hope this helps you build an MIS from which you can get some genuine support in reporting and decision-making.
Such a wholesome post Shoumik!!
I have a doubt, where do we show ESOP buyback and ESOP expense for the period (Say monthy)? Shall it be below EBIDTA or is it part of normal Manpower cost and hence above EBIDTA? What is the general practice in startups?